• Skip to primary navigation
  • Skip to main content
  • Skip to primary sidebar

Forex News

Currency Trends & Insights

  • Forex News
  • Forex Brokers
    • AvaFX Review
    • Easy Forex Review
    • eToro Review
  • Glossary
  • Articles
    • The FOREX Market Overview
    • Can I Profit from Money Exchange Rates?
    • The Role of Supply and Demand
    • Advantages of Forex Trading
    • Factors that Directly Affect Forex Trading

EURUSD

EUR/USD Weekly Analysis 26 June 2017 – Rangebound in a Quiet Market

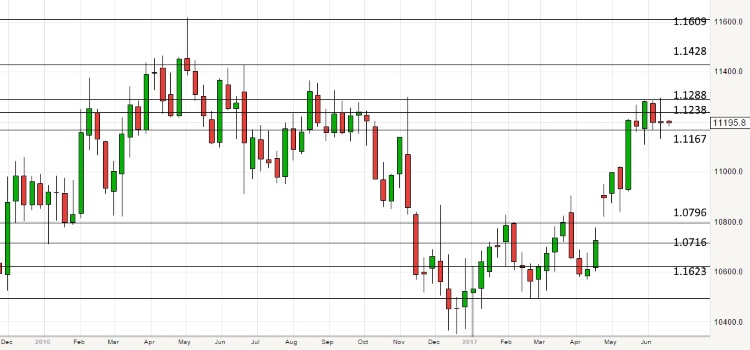
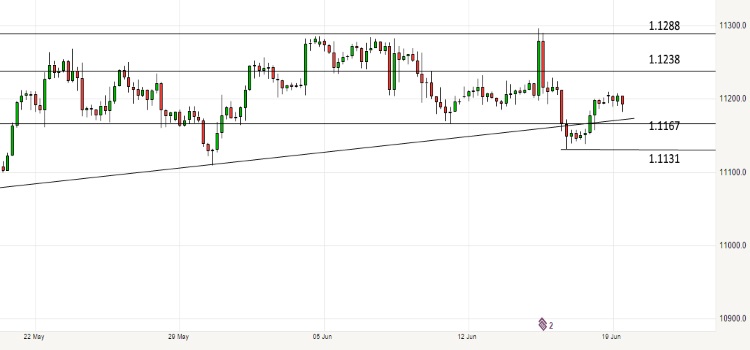
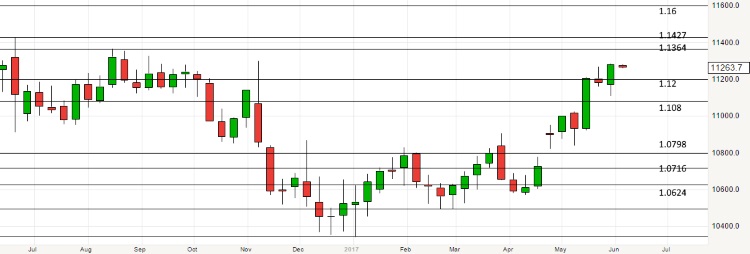
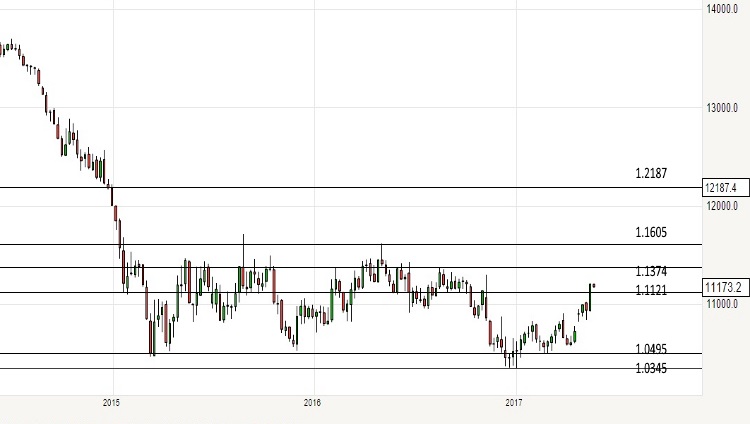
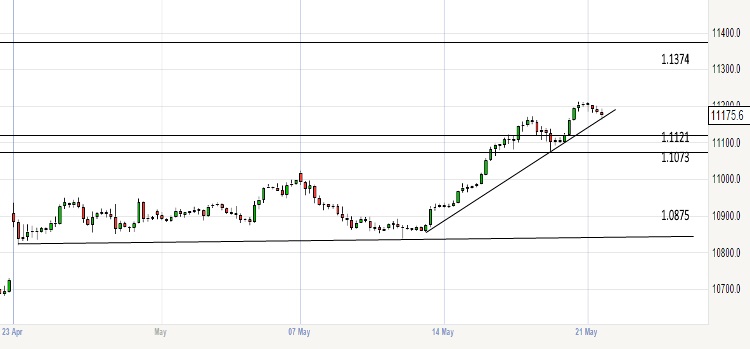
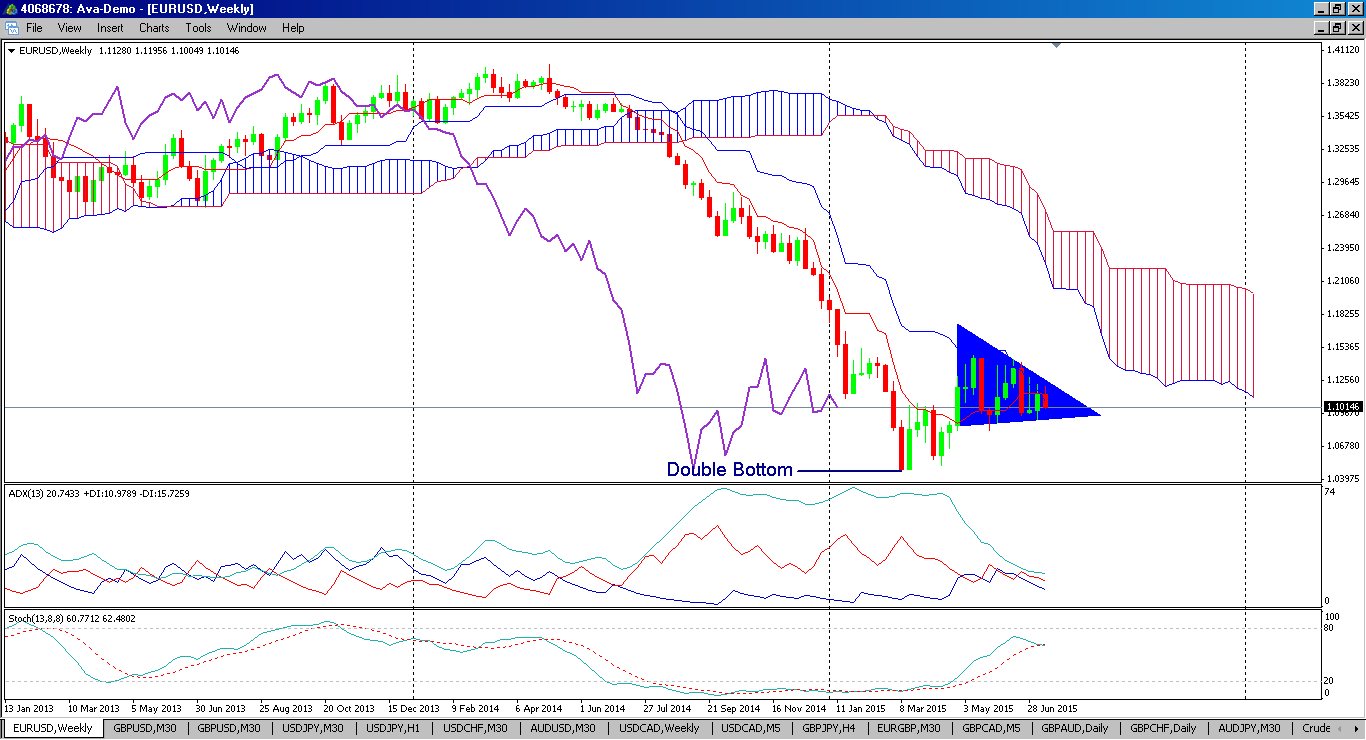
The EURUSD remains in a range which forms a bull flag on the longer-term charts. Activity has tapered off ahead of summer holidays, and news flow is expected to be quiet. Both the top and the bottom of the range have already been convincingly tested and held. Fundamentals and the chart pattern still support long term Euro strength, but that may take some time to play out. Longer-term traders should look for long trades at the bottom of the range, while short-term traders can trade within the range.

EUR/USD Weekly Chart – The bull flag enters its 6th week

For more news, analysis and information go to http://www.eurusd.co/analysis/a-well-established-range-26-june-2017.html

EUR/USD Weekly Analysis 19 June 2017 – a Rangebound Market with a Slightly Bullish Bias

The Fed hiked rates as expected and Janet Yellen insisted they will raise rates again this year. The USD did strengthen on the back of these comments, but gave up most of those gains when weak consumer confidence and housing data was released on Friday. The market is not convinced by Yellen’s stance, which is being contradicted by economic data. Trump’s agenda appears to have stalled and he will need to begin to make progress if we are to see USD strength again. In the meantime the market remains rangebound between 1.114 and 1.13.

(EUR/USD Weekly – Coud be a top, but probably a bull flag)

(EUR/USD 4-Hour – Currently Rangebound)

For the complete analysis go to http://www.eurusd.co/analysis/the-retracement-loses-steam-19-june-2017.html

EUR/USD Weekly Analysis 5 June 2017 – News Flow to Dominate the EUR/USD Story this Week

The technical picture for the Euro is quite simply that it is going up. The charts are telling us very little about how fast that may be or how deep the corrections may be.

(EUR/USD Weekly Chart – The rally resumes)

However, there is plenty of news and data this week, and fundamentals will probably drive the price. The ECB is meeting, Eurozone retail data will be released and so will US manufacturing data. On Thursday, the UK heads to the polls and James Comey testifies in the US. This is a week where anything could happen. There is a case to be made for a sharp selloff at some point, but that will need a catalyst before it happens.

(EUR/USD 4-Hour Chart – technicals will take a back seat as fundamentals dominate this week)

For the full analysis go to http://www.eurusd.co/analysis/the-euro-next-leg-higher-has-begun-5-june-2017.html

EUR/USD Weekly Analysis 22 May 2017 – The Euro Gathers Momentum

A combination of Euro strength and Dollar weakness has created a very strong trend for the Euro. This is now prompting dollar bulls to get out of their positions, which adds to the trend.

Before we have a clear idea of where the Euro is headed in the long term we will have to see a test if 1.16, and so price action in the short term will be targeting that level.

(EUR/USD Weekly chart – The Euro needs to test the top of the range)

Right now, the best strategy is to buy dips with a target of 1.1374, but we may have to wait for a bigger correction to 1.0875 to set up a really profitable, high probability trade.

(EUR/USD 4-Hour Chart – A clear medium term target at 1.1374)

There are a lot of speculative Euro longs in the market, and plenty of leverage is being used. That means a correction may be severe, so traders must obey their stops in this environment.

For the complete analysis and strategy click here http://www.eurusd.co/analysis/dollar-bulls-are-liquidating-22-may-2017.html

ECB, RBA Rates Remain Unchanged, Aussie GDP Slowed Most in Two Years

The Reserve Bank of Australia left Cash Rate at 2 percent as weakness in the Australian dollar has cushioned the blow of China’s weakness and lower commodity prices.

Australian GDP revealed its weakest growth in two years as it posted 0.2 percent in the second quarter, mainly due to the weakness in export volumes, the latest report from the Australian Bureau of Statistics showed. Retail Sales posted an unexpected 0.1 percent dip in July, the first monthly decline since May 2014. Trade Balance report showed a lower-than-expected deficit of –AUD2.46 billion (analysts were expecting –AUD3.10 billion).

The European Central Bank also kept its minimum bid rate unchanged at 0.05 percent on Thursday. In the press conference, ECB chief Mario Draghi said the bank is lowering its inflation and growth forecasts. Inflation is expected to pick up slightly towards the yearend, he noted. The ECB also mentioned that it has changed its rules regarding the limit on bond issue share, increasing the limit to bond issues the central bank can hold to 33 percent from 25 percent.

In other news, the UK Manufacturing PMI came in at 51.5 for August, following a small increase to 51.9 in July. Net Lending to Individuals stood at GBP3.9 billion as expected. On the other hand, Construction PMI came in close to expectations at 57.3 (57.6 forecast).

In the United States, Chicago PMI came in at 54.4 versus 54.7 expected. ISM Manufacturing PMI registered its lowest reading since June 2013 at 51.1, while ISM Non-Manufacturing PMI came in at 59.0. Jobless Claims in the prior week increased 282,000, 9,000 more than the median forecast. The Non-Farm Employment Change showed an increase of 173,000 in August, disappointing and diverging from the 215,000 forecast. Average Hourly Earnings picked up 0.3 percent, and Jobless Rate eased to 5.1 percent.

 Commodities

Gold sellers won for the second week but not much new ground has been covered this time. Downside risk remains, as price has not recovered the $1,200 level despite the big pushes seen in August. $1,200 will remains an area for buyers to conquer moving forward.

After an enduring multi-month slide, a volatile week saw Oil move, for the most part, between the $43 and $49 zone. The move this week was not surprising given the relentless downside force exerted on black gold. Bulls need a move through $50 to keep this going.

Currency Pairs

EURUSD is back to its normal trading range after a wild end to the month of August. The pair is back below the 1.1400 resistance level and some buyers are attempting to poke through it again. It retains it bullish bias as long as price is below 1.1100.

GBPUSD posted its ninth straight bearish day on Friday as sellers attempt to push for a 1.5100 break. This pair would remain in seller’s territory if bulls won’t be able to bring this back above 1.5500. Let’s see if that would be a tall order for bulls, given the recent slump.

USDJPY posted its third consecutive bearish weekly close but this time it was engulfed by the prior huge weekly bar. Due to the recent JPY strength, this pair has a short-term bearish bias while price is below 122. Medium term, this pair is bullish as long as it remains above 120.

The Week Ahead

On Monday, keep an eye on Australia’s ANZ Job Advertisement; Japan’s Leading Indicators; Switzerland’s Foreign Currency Reserves; and Germany’s Industrial Production. Canada and the US will celebrate Labor Day.

Tuesday will offer Japan’s Current Account and Final GDP; Australia’s NAB Business Confidence; China’s, France’s, and Germany’s Trade Balance; Switzerland’s Jobless Rate; and US NFIB Small Business Index.

Wednesday will be much more active with Australia’s Westpac Consumer Sentiment and Home Loans; UK Halifax HPI, Manufacturing Production, and Trade Balance; Canada’s Building Permits, BOC Rate Statement and Announcement; and US JOLTS Job Openings.

Thursday will be extra busy with RBNZ Rate Announcement, Monetary Policy Statement, and Press conference; Japan’s Core Machinery Orders; Australia’s jobs data; China’s CPI, PPI, and New Loans; UK MPC’s Asset Purchase Facility and Official Bank Rate Votes and Rate Statement; US Unemployment Claims and Import Prices.

Friday will cap the week with Japan’s BSI Manufacturing Index; Germany’s WPI and Final CPI; ECOFIN Meetings; US PPI and Preliminary UoM Consumer Sentiment.

Yuan Devaluation Rattles Markets; Greece Approves Deal Amid Growing Opposition

China’s central bank rocked global markets this week as it initiated devaluation of the Yuan, saying it would begin setting the daily rate based in part on the prior day’s trading. In a press conference on Thursday, PBOC discussed its recent policy moves and Deputy Governor Yi Gang said “adjustment is almost complete”. He further said the possibility of a 10 percent devaluation was “nonsense”, amidst rumors of some government figures pushing for a bigger depreciation. The PBOC started Yuan devaluation on Tuesday by 1.9 percent, 1.6 percent on Wednesday, and finally 1.1 percent on Thursday. Despite the devaluation, PBOC also intervened to manage currency volatility, keeping the market in check.

China’s New Loans surged to CNY1.480 billion in July. This is more than double the median estimate and the third straight monthly increase. M2 Money Supply grew 13.3 percent. Industrial Production and Retail Sales came in at 6 percent and 10.5 percent, respectively.

Japan’s Core Machinery Orders fell 7.9 percent in June, its lowest reading since May 2014.

German ZEW Economic Sentiment slipped to 25.0 from July’s 29.7. This is its fifth consecutive monthly decline. In contrast, the Eurozone German ZEW Economic Sentiment improved to 47.6.

In Greece, the parliament on Friday voted in favor of implementing the measures for the third bailout program. 222 Greek MPs voted Yes and 64 voted No, with a growing number of SYRIZA lawmakers opposing the deal, the third bailout in the last five years. Euro finance ministers will approve lending 85.5 billion Euros in the next three years to Greece for stability support.

 Commodities

Gold recovered this week as it traded within a $37 trading range and pushed through $1,100. An initial bounce toward $1,150 remains possible amidst a bearish backdrop while price is below $1,250.

Oil completed its ninth straight weekly bearish close this week as more sellers joined. The $40 level is now on target, and a move toward the $30-$35 zone is now an increased possibility. Traders should avoid buying any dip.

Currency Pairs

EURUSD recovered this week further after price failed to make a new weekly low. The pair was able to move past 1.1200 but topside selling made it close the week much lower. The goal of buyers for the next few weeks is to sustain momentum and target 1.1400 again.

GBPUSD came close to taking out previous week’s low, but in the end it just formed a bullish weekly inside bar. This was a positive result, which could pave the way for a breakout toward 1.5900 in the coming week or so. This is a big possibility unless support around 1.5400 will be cleared.

The 125 level in USDJPY has been reached but the last three weekly closes has been far from ideal. Most moves towards that level has been thwarted by sellers easily, and this could become a bigger concern for bulls starting this coming week. Sellers could aim for a break of 124 this week.

The Week Ahead

This week will be less active, overall, compared to previous weeks. However, activity would be more evenly distributed.

Monday will offer Japan’s Prelim GDP; Switzerland’s Retail Sales; Canada’s Foreign Securities Purchases; US Empire State Manufacturing Index;

Tuesday will have RBA’s Monetary Policy Meeting Minutes; UK CPI, RPI, PPI Output and HPI; US Building Permits and Housing Starts.

Wednesday will be unusually compact with New Zealand’s PPI Input and PPI Output; Japan’s Trade Balance; US CPI and FOMC Meeting Minutes.

Thursday will have Bank of Japan’s Monetary Policy Statement and press conference; Switzerland’s Trade Balance; UK Retail Sales; Canada’s Wholesale Sales; US Jobless Claims, Existing Home Sales, and Philly Fed Manufacturing Index.

Friday will remain active with China’s Caixin Flash Manufacturing PMI; Flash Manufacturing PMI and Flash Services PMI from France, Germany, and the Eurozone; UK Public Sector Net Borrowing; Canada’s CPI and Retail Sales; and US Flash Manufacturing PMI.

RBA, BOE Put Rate on Hold; Canada, US, NZ, Australia Jobs Outlook Diverge

On Tuesday, the Reserve Bank of Australia left the Cash Rate unchanged at 2 percent. Meanwhile, the Bank of England kept its Official Bank Rate at 0.50 percent. The latest Official Bank Rate votes surprisingly showed only one policymaker out of nine, Ian McCafferty, saw the need to raise rates. Analysts expected two BOE MPC members would want to hike rates. The Asset Purchase Facility (APF) and APF votes came in line with expectations (GBP375 billion and 0-0-9, respectively). BOE Governor Carney hinted that the first rate hike could happen next year but would be “data dependent”.

On the global employment front, New Zealand’s Employment Change fared lower than forecast at 0.3 percent, while the Unemployment Rate came in at 5.9 percent, as expected. On the other hand, Australia’s Employment Change was much stronger as employers added 38,500 jobs in July, but the Jobless Rate slipped to 6.3 percent from 6.1 percent. In the United States, Non-Farm Employment Change was 7,000 below the 222,000 forecast, while the previous reading has been revised higher to 231,000. US Jobless Rate remained fixed at 5.3 percent for the second month in July, according to the latest Bureau of Labor Statistics data. Canada’s Jobless Rate stayed at 6.8 percent for the sixth straight month.

In other news, Australia’s Retail Sales and Trade Balance came in better than forecast. Home Loans were lower at 4.4 percent, while previous reading was revised lower to -7.3 percent.

In the United States, ISM Manufacturing PMI and ISM Manufacturing Prices slipped to 52.7 and 44.0, respectively. However, ISM Non-Manufacturing PMI jumped to 60.3, its best reading since 2005.

Commodities

Gold posted its second weekly inside bar after price hovered just below the $1,100 area. We could then see a bounce toward $1,150-$1,200 initially. However, downtrend remains firm as long as price stays below $1,250.

Oil tracked lower again this week, printing its eighth straight weekly bearish close. The triple bottom is now fully in play, and we could see fireworks in the coming days or weeks. Price is looking for new lows – new multi-year lows, in fact. It is now staring at a possibility of price heading for the $30-$35 zone.

Currency Pairs

EURUSD has been sticking close to the 1.100 level for several weeks now. With the pair’s failure to create a new weekly low, we can see bulls attempt for a move toward 1.1400 again. This area is possibly rich in armies of sellers.

GBPUSD traders are battling within a tight range for the fifth week now. If this pair wants to track higher, it should take out the 1.5700 this week so it can head to 1.5900. Otherwise, GBPUSD would stay in a range, which could trade as low as 1.5400.

Slowly but surely, USDJPY has been moving higher toward 125 for the past couple of weeks. The pair remains content, for now, in staying below 125 (although this figure has been touched twice this week). If it continues to march higher, the June 5 high below 126 is the next target.

The Week Ahead

Monday will offer Japan’s Current Account, Consumer Confidence, and BOJ Monthly Report; and speeches from US FOMC Member Lockhart and Fischer.

Tuesday will start quite early with UK’s BRC Retail Sales Monitor. This will be followed by Australia’s NAB Business Confidence and HPI; China’s New Loans; Germany and Eurozone ZEW Economic Sentiment; Canada’s Housing Starts; and US Prelim Unit Labor Costs and Prelim Nonfarm Productivity.

Wednesday will get busy with Japan’s BOJ Monetary Policy Meeting Minute; Australia’s Wage Price Index and Westpac Consumer Sentiment; China’s Industrial Production, Retail Sales, and Fixed Asset Investment; UK Average Earnings Index, Jobless Rate, and Claimant Count Change; and JOLTS Job Openings

Thursday will be critical again for Greece as its set for another Debt Crisis Vote. Other important news to watch out for include New Zealand’s Business NZ Manufacturing Index and FPI; Japan’s Core Machinery Orders; Australia’s MI Inflation Expectations; France’s CPI; ECB Monetary Policy Meeting Accounts; US Jobless Claims, Retail Sales, Business Inventories and Import Prices.

Friday will have moderate news activity with New Zealand’s Retail Sales; Germany’s Prelim GDP; Eurozone Flash GDP; Eurogroup Meetings; Canada’s Manufacturing Sales; US PPI, TIC Long-Term Purchases, Empire State Manufacturing Index, Industrial Production, Capacity Utilization Rate, and Prelim UoM Consumer Sentiment.

2nd Greek Bailout Vote Passes, Gold & Oil Continue their Decline

The Greek government approved on Thursday some reform-related demands of creditors in order to stay in the Eurozone. The televised voting showed 151 lawmakers supported Prime Minister Alexis Tsipras in passing the second tranche of policy measures. Meanwhile, in his speech in Frankfurt on the same day as the Greek vote, Bundesbank President Weidmann commented that the ESM is only able to provide credit to solvent states.

In the United Kingdom, the MPC voted as expected (no change) in relation to the Official Bank Rate and Asset Purchase Facility. On the other hand, the RBNZ reduced its Official Cash Rate to 3 percent from 3.25 percent as expected on Thursday. The central bank chief expects the New Zealand Dollar to depreciate further amidst weakness in commodity prices. Governor Wheeler further noted that further easing in rates is “likely”.

In other news, Canada’s Wholesale Sales dipped 1 percent in May, while previous reading revised down to 1.7 percent. Retail Sales, both the main and core readings, were higher than anticipated.

New Zealand Trade Balance posted a NZD60 million deficit in June, in contrast to a NZD100 million surplus expected. The previous reading was revised higher to NZD370 million.

US Existing Home Sales came in slightly higher than forecast at 5.49 million in June, but May‘s reading was revised down to 5.32 million from 5.35 million. New Home Sales only gained 482,000 in June compared to 543,000 expected. May’s reading was similar with April’s at 517,000.

Jobless Claims for the previous week came in at 255,000 compared to the 279,000 forecast.

Commodities

Gold created a $57 range this week as it posted its fifth straight weekly downside track and reaching its lowest price in over five years. The next critical support now comes at $1000.

Oil went on post its sixth weekly decline and it broke the $50 level with confidence. The chance for a move to create a triple bottom has therefore increased and we could expect that this coming week. Sellers will now target the $40 to $44 area.

Currency Pairs

EURUSD managed to post some gains this week after pulling close to the 1.0800 level again. Buyers still need to prove their might by forcing through the 1.1450 resistance area. That area is critical if bulls want to revisit the 1.2000s again.

GBPUSD posted an inside bar this week as the 1.5500 level continues to attract buyers and sellers on both sides. Buyers have a slight upper hand here as long as they can maintain a good support around 1.5500. Next target area is 1.5900.

USDJPY posted below-average weekly activity this week after making a strong showing in the past two weeks. Sellers entered the fray around the 124 level, keeping a lid on growing confidence of the buyers. The June 5 high below 126 is the next target.

 The Week Ahead

The overall news activity for this week would be lower than average as July draws to a close.

Monday will showcase Germany’s Ifo Business Climate; Eurozone M3 Money Supply; and US Durable Goods Orders.

Tuesday will remain quiet with UK’s Prelim GDP; Canada’s RMPI and IPPI; and US Consumer Confidence and Richmond Manufacturing Index.

Wednesday will have Japan’s Retail Sales; Germany’s GfK Consumer Climate; UK Net Lending to Individuals and Mortgage Approvals; US Pending Home Sales, and Fed Rate Announcement and Statement.

Thursday will offer more activity with Australia’s Building Approvals and Import Prices; Germany’s Prelim CPI and Unemployment Change; Spain’s Flash CPI and Flash GDP; US Unemployment Claims, Goods Trade Balance, Advance GDP, and Advance GDP Price Index.

Friday will end the week with Japan’s Household Spending, Tokyo Core CPI, and Jobless Rate; New Zealand’s ANZ Business Confidence; Australia’s PPI; Germany’s Retail Sales; France’s Consumer Spending; Eurozone CPI Flash Estimate and Jobless Rate; Canada’s GDP; US Employment Cost Index, Revised UoM Consumer Sentiment, and Chicago PMI.

Greece Stays in EU as Bailout Vote Passes, Euro Declines

The lawmakers in the Greek government approved the bailout agreement on Thursday, allowing the country to remain as a member of the Eurozone. The latest austerity measures have been approved as part of the 86 billion euro aid.

In its latest decision, the ECB’s Minimum Bid Rate stayed at 0.05 percent as expected. However, Bank of Canada reduced its Overnight Rate by 25 percentage points to 0.50 percent as the bank acknowledged the bigger contraction seen in the first half of the year. This is the second rate cut for BOC this year.

In Europe, the German ZEW Economic Sentiment missed estimates and declined to 29.7 from 31.5 from June. The Eurozone counterpart also declined, from 53.7 to 42.7.

UK CPI is flat but PPI Input slipped -1.3 percent, worse than the 0.7 percent dip expected. Jobless Rate increased back to 5.6 percent in July, after two consecutive months of stay at 5.5 percent.

In the United States, the main and core readings of Retail Sales surprisingly declined in May (-0.3 percent and -0.1 percent, respectively). Jobless Claims for the prior week was 3,000 less than expected at 281,000. The Philly Fed Manufacturing Index sank to 5.7 after posting 15.2 in June. Building Permits and Housing Starts increased In June (1.34M and 1.17M respectively). This housing starts figure is the second best reading since late 2007 as builders did more apartment projects. The UoM Consumer Sentiment stayed above 90 at 93.3, but this is lower than the median forecast of 96.

Commodities

Gold is now on its fourth weekly decline as buyers failed to push price back through $1,200. The strong bearish weekly close could signal that price is still willing to move further downward. We now have a weekly triple bottom close to getting broken.

Oil posted its fifth weekly decline and it’s now closer to breaking the $50 level. The triple bottom is getting closer to becoming a reality. Buyers need to be careful and seek support around that key $50 level.

Currency Pairs

Out of five daily closes, EURUSD slipped for four days, giving the pair a very bearish weekly close. This close is in fact its lowest close in at least the past 12 weeks. This pair is likely to revisit the double bottom in the early part of this year.

Although GBPUSD closed higher this week, it showed signs that price is having trouble in the upper-1.56s. 1.5600 could remain attractive to both sellers and buyers.

The significant turnaround in the prior week paved the way for USDJPY to gather momentum higher this week. Resistance remains around 124, then the June 5 high below 126.

The Week Ahead

Monday will mostly be quiet except for the release of China’s New Loans; Germany’s PPI and Bundesbank Monthly Report; and Canada’s Wholesale Sales. Japanese banks will observe Marine Day.

Activity will pick up slightly on Tuesday starting with the publication of Policy Meeting Minutes from BOJ and RBA. This will be followed by the release of Switzerland’s Trade Balance; and UK Public Sector Net Borrowing.

Wednesday’s will have more news activity with Australia’s CPI and Trimmed Mean CPI; UK MPC Asset Purchase and Official Bank Rate votes; and US Existing Home Sales.

Thursday will have New Zealand’s RBNZ Rate Announcement and Statement; Japan’s Trade Balance; China’s CB Leading Index; Greek Government Debt Crisis Vote; Spain’s Jobless Rate; UK Retail Sales; Buba Weidmann’s speech; Canada’s Retail Sales; and US Jobless Claims.

Friday ends the week with New Zealand’s Trade Balance; China’s Markit Flash Manufacturing PMI; France, Germany, and Eurozone Flash Manufacturing and Services PMI; US New Home Sales and Flash Manufacturing PMI.

EUR/USD Rally Reduced to Range Bound Trading

Daily Time Frame – EUR/USD Reversal Beginning to Falter

Support: 1.09647, 1.08449, 1.04626
Resistance: 1.10845, 1.12313, 1.14502

Strategy: Enter Long positions when price bounces off 1.09647, Stop Loss 60/70 pips Take Profit as price reaches 1.12313.

Looking at the Day Chart we can see that price action for the past 17 days has been within a range set by the 23.6% and 50% Fibonacci retracement lines between 1.0964 and 1.1231. That is a fairly wide range which is not surprising given the most recent events concerning a possible Grexit.
The Euro reversed its downward trend, after reaching a low of 1.04611, on March 13th giving way to a rally that reached a recent high on May 15th at 1.14501. Drawing the Fibonacci retracement lines between these two points has given the two levels mentioned above which have acted as support and resistance. The Euro would still seem to be in a possible Bull trend, short term, as price action has not been able to break the downside of the Ichimoku cloud. ADX/DMI and Stochastic Oscillator are both showing signs of lack of momentum, coherent with recent range trading activity.

2015-07-13-eurusd-day-chart

4 HR chart showing signs of weakness

Support: 1.09647, 1.09150, 1.08449
Resistance: 1.10845, 1.12313, 1.14501

Strategy: Enter Long positions between 1.09647 and 1.09150 Stop Loss 30/50 pips Target Profit 1.10845

On the 4HR chart we can see that price broke the bottom side of the Ichimoku cloud and remained below it for most of June through to the beginning of July. An attempt to break the cloud on the upside failed 8 candles back, where price met the resistance of the cloud, the lagging line failed to break the cloud and the resistance of the 23.6% line. This may open up to more downward momentum in the coming days, but we have to see a strong close below the cloud on the Day chart and preferably also below the 50% line, it is also important for the lagging line to confirm the break by closing below the cloud.

2015-07-13-eurusd-4h-chart

Weekly time frame – Bear Trend may have reversed

Support: 1.08222, 1.05873, 1.04598
Resistance: 1.1145, 1.14501, 1.17222

Strategy: Long positions between 1.09500 and 1.10250 Stop Loss below 1.0773 Target Profit below 1.17222
The medium term trend still remains a Bear trend considering the weaker GDP growth rate, low interest rate environment and generally sluggish European economy. Looking at the weekly chart this trend seems quite evident; however we may have run into a double bottom as indicated in the chart, price action from that 2 candle pattern has shown higher prices and also given rise to what may be a continuation triangle. A break on either side of this triangle should show the next direction over several weeks. The Stochastic Oscillator is showing upward momentum, although the fast line is closing in on the slow line, so it remains to be seen if there is a cross over indicating a possible return to downward momentum. The ADX/DMI on the weekly chart is also showing lack of momentum or sideways price action.

 2015-07-13-eurusd-weekly-chart

Monthly time frame – Consolidation in an oversold area

Support: 1.08178, 1.04626, 0.99220
Resistance: 1.14501, 1.17222, 1.22267

Strategy: Long positions below 1.09500 Stop loss below 1.04626 Target Profit below 1.22267

The monthly chart shows a big consolidation area happing over the past 4 months. Price action also formed a double bottom on the purple line over the months of March and April. The ADX and Stochastic Oscillator are both showing signs of oversold territory, ADX above 60 on a Monthly chart is extremely high, the SO is crossing over to upward momentum from below twenty, both indicate strong chances of a move upwards.

I see the short term upward trend continuing once a solution is reached with Greece, resistance area will be its most recent high at 1.14502 which will also coincide with the bottom of the Ichimoku cloud on the Weekly chart, the next resistance should that not hold I see at 1.1826, that should take us through the summer after which the downward trend for the Euro should continue as a US rate hike will begin to be closer to materializing.

 2015-07-13-eurusd-monthly-chart

Next Page »

Primary Sidebar

Categories

  • Analysis (151)
  • Books (1)
  • Brokers (1)
  • Euro (97)
  • EURUSD (141)
  • GBPUSD (106)
  • General (139)
  • Signals (6)
  • Yuan (1)

Archives

Free Updates

Enter your email address: